Coastal change, cited
Years of coastal change, in one cited timeline
Draw a site once. TideFrame assembles a co-registered, year-by-year aerial and satellite record with the habitat surveys of record on top. You can measure it, cite it and share it.
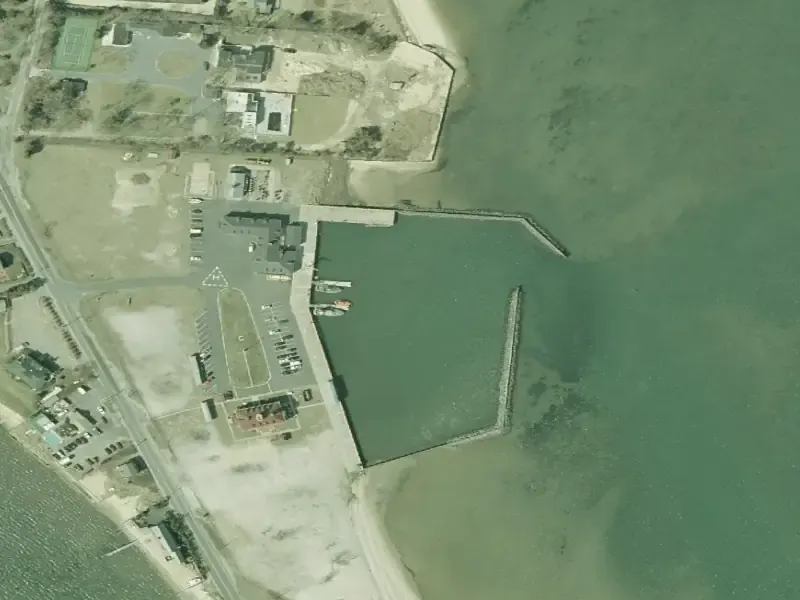
- Source
- NY State Orthoimagery
- Resolution
- 6 in/px
- Vintage
- 2001
- Accessed
- October 19, 2026
- SAV NYSDEC Seagrass Management, South Shore Estuary Reserve benthic habitat survey, 2019
- Shoreline NOAA National Geodetic Survey, Continually Updated Shoreline Product (CUSP)
- Salt marsh No polygons returned for this site. A missing polygon means not surveyed.
- Range2001 to 2023Eight aligned frames
- NY State orthoimagery6 in/pxAerial
- USDA NAIP0.6 m/pxAerial
- Sentinel-210 m/pxSatellite
- CitationEvery frameSource, resolution, vintage, access date
What it does
01 TIMELINE02 OVERLAYS03 COMPARE04 MEASURE05 CITE06 SHARE- Source
- NY State Orthoimagery
- Resolution
- 6 in/px
- Vintage
- 2001
- Accessed
- October 19, 2026
- Frame
- 1 / 8
- Vintage
- 2001
- Source
- NY State Orthoimagery
Highlighted: the year scrubber under the frame.
| Layer | Source | Shown |
|---|---|---|
| SAV (seagrass) | NYSDEC Seagrass Management, South Shore Estuary Reserve benthic habitat survey, 2019 | |
| Salt marsh | NYSDEC Official Regulatory Tidal Wetlands Inventory. No polygons returned for this site. A missing polygon means not surveyed. | No polygons returned for this site |
| NWI wetlands | USFWS National Wetlands Inventory. Not drawn on this demo frame. | Not drawn here |
| CUSP shoreline | NOAA National Geodetic Survey, Continually Updated Shoreline Product (CUSP) |
- Left of divider
- 2004
- Right of divider
- 2023
- Divider
- 64%
Both frames are reprojected to identical bounds, so a change between them is a change on the ground, not a shift in the image.
Highlighted: the divider, both year labels and both citations.
- Length
- Drawing
- Frame width
- 393 m
- Pixel size
- 0.49 m
- Datum
- WGS 84
Click two points on the frame. Area, radius and preset footprints work the same way in the full tool.
Highlighted: the measured line and the length readout.
- Source
- NY State Orthoimagery
- Resolution
- 6 in/px
- Vintage
- 2001
- Accessed
- October 19, 2026
The line changes with the frame because it comes from the frame. It travels with the image into your report.
Highlighted: the citation on the frame and under it.
- WatermarkedEvery shared view carries the mark.
- Time limitedThe link stops working on the date you set.
- GatedA colleague or funder sees the site without getting the keys.
This demo does not create a link. The mark above shows how a shared view looks.
Highlighted: the read-only mark and the three controls.
Same site, 2004 and 2023
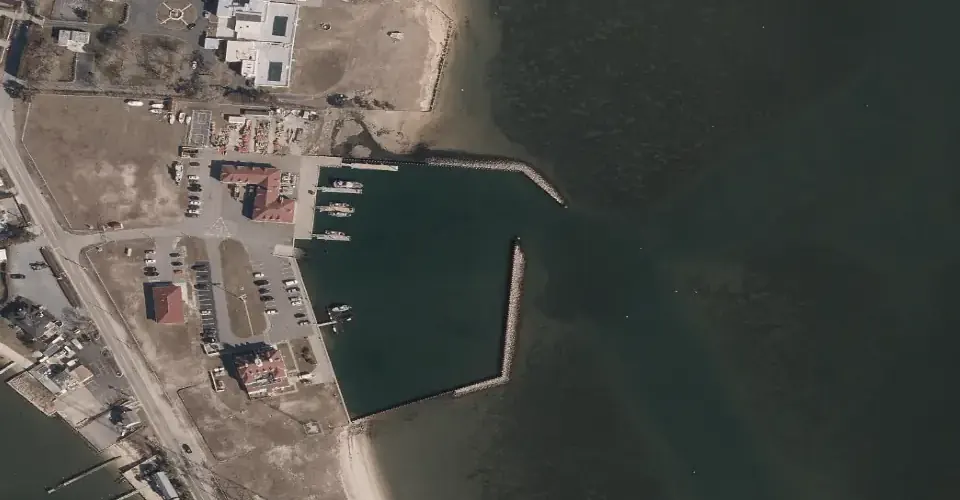
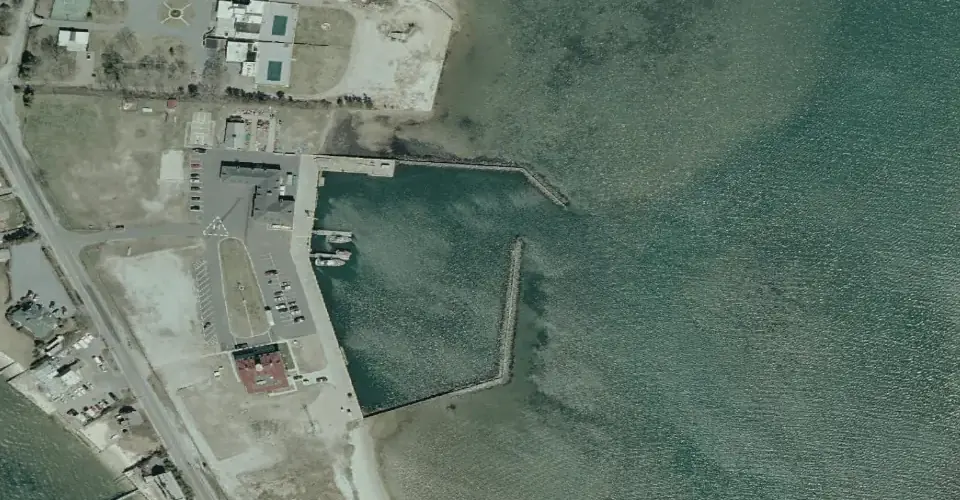
Both frames are reprojected to identical bounds, so a change between them is a change on the ground, not a shift in the image.
- Vintage
- 2004
- Source
- NY State Orthoimagery
- Resolution
- 6 in/px
- Accessed
- October 19, 2026
- Vintage
- 2023
- Source
- NY State Orthoimagery
- Resolution
- 6 in/px
- Accessed
- October 19, 2026
Skip the hunt for imagery
The problem
Monitoring a coastal site usually means downloading scenes from half a dozen archives and aligning them by hand. It is slow, and the result is rarely something you can cite.
The answer
Define an area of interest and TideFrame assembles the timeline from the best available aerial and satellite sources, in minutes, not weeks.
03 Validity
“Not detected” is never “not present.”
A timeline is only worth as much as you can trust it. TideFrame is built for scientists and agencies who have to defend what they put in a report, so it is rigorous about its data and candid about its limits.
What TideFrame shows
- Published surveys of record. Habitat boundaries come from VIMS, NYSDEC, NOAA, USGS and Copernicus, not from a model guessing at the pixels.
- Frames that are truly aligned. Every source is reprojected to the exact area-of-interest bounds, so when two frames look aligned, they are.
- A citation on every frame. Provider, resolution, vintage and access date travel with the image into your report.
What it will not claim
- It cannot see everything. Passive optical imagery cannot see subtidal vegetation in turbid water, and TideFrame says so.
- Not detected is not absent. "Not detected" is never presented as "not present".
- A missing polygon is not a finding. A missing survey polygon means "not surveyed", not "no habitat".
- Years are vintages. Imagery years are not exact acquisition dates, and apparent extent varies with tide stage, sun glint and water clarity on the day a scene was captured.
Built on the data of record
| Source | What it provides | Resolution or vintage |
|---|---|---|
| NY State Orthoimagery | Aerial orthoimagery | 6 in/px |
| USDA NAIP | Aerial imagery | 0.6 m/px |
| Copernicus and ESA Sentinel-2 | Satellite imagery, plus derived NDWI, turbidity and chlorophyll layers | 10 m/px |
| NOAA | Continually Updated Shoreline Product (CUSP) and other coastal layers | |
| USGS | National Assessment of Shoreline Change: dated shorelines and erosion rates | |
| USFWS National Wetlands Inventory | Wetland polygons with Cowardin classification | |
| VIMS Chesapeake Bay SAV | Annual submerged aquatic vegetation survey of Chesapeake Bay and the coastal bays | |
| NYSDEC | Regulatory tidal wetlands inventory and seagrass surveys | Seagrass surveys: 2014, 2017, 2019 |
See TideFrame on your site
Available for pilots, licensing and agency deployments. Tell us about your site and we will show you the timeline.